1. Overview
The graphic order flow trading package combines the power of footprint/order flow charts with the more pleasing look of a normal candle chart. This trading template will display all the important footprint & order flow signals on a normal candlestick chart. No longer do you have to look at those footprint charts with 1000s of bid/ask numbers and zoom in so close that you lose the bigger picture. Instead, use normal candlestick charts with any bar type you like, without losing any of the important footprint signals. We took a good look at all the order flow signals and only took the best, high probability signals and made this special trading template to display them in a clean, easy and pleasing look on any normal chart.
Includes:
- The Orderflow zigzag indicator
- The Orderflow zigzag histogram indicator
- The Buy/Sell momentum indicator
- The McGinley River indicator
- The Devils Volume Indicator
- The Traders Dynamic Index (TDI) indicator)
- The market extremes indicator

2. Orderflow ATR Zigzag indicator
The order flow zigzag indicator is our custom zigzag indicator. It detects price swings in the market and uses these price swings to calculate and display various order flow signals:
- Shows price swings based on ATR, ticks, points, or percentage
- Draws auto-Fibonacci retracements
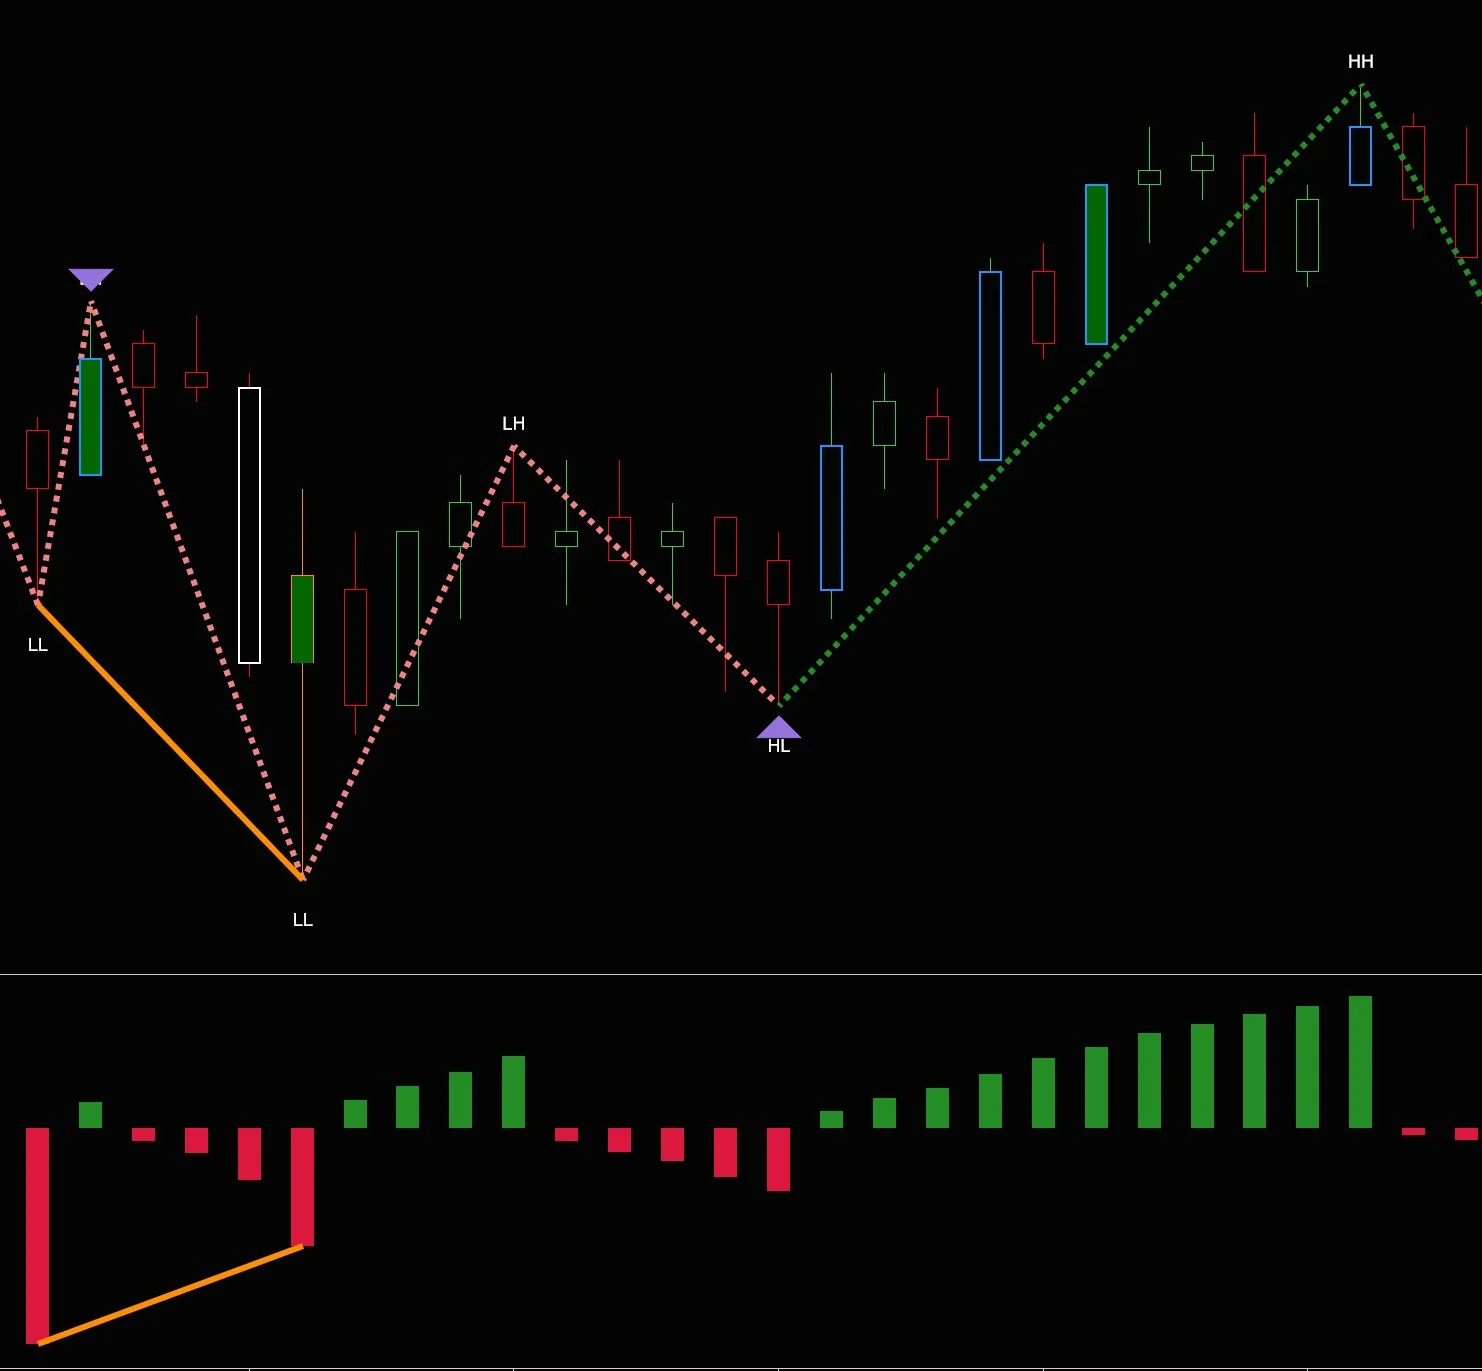
- HH/LL/LH/HL markers
- Price/Volume divergence signal
- No-interest reversal signal
2.1 ATR, ticks, points, or percentage
The order flow zigzag indicator can use the ATR (average true range) to find new swing points or pivots. Of course, you can also choose to determine new swing points by ticks, points, or percentage. But using the ATR is far more effective.
Remember that the price swings detected by our custom zigzag indicator are the base for all our order flow signals. Thus we want the best possible price swings which resemble the ones you would have drawn manually
By using the ATR to detect the price swings we are able to take the market volatility into account and because of this the price swings found are much better than those of the default zigzag indicator which comes with NinjaTrader.

2.2 Auto Fibonacci retracements
The order flow indicator automatically shows the 50% and 61.% Fibonacci retracements for the last price swing. These Fibonacci levels often act as strong support/resistance. By automatically letting the indicator draw these Fibonacci levels on the chart we never forget they are there. And when we get multiple signals at one of these Fibonacci levels then we know that these will be the high probability setups you would be interested in to open a trade


2.3 HH/LL markers
The order flow zigzag indicator can show HH/LL/HL/LH markers at the swingpoints. This way you are quickly reminded if we are in a trend or a choppy market. if we see HH and HL we know we are in an up-trending market, and if we see LL and LH we know we are in a down-trending market. Any other combination would indicate congestion and these are the times we want to be very careful opening new trades.

2.4 Volume / Price divergence signal
The volume/price divergence signal occurs when the indicator detects divergence between volume and price. When for example price makes a new high, but with a lower volume than the last upswing then we consider this a price/volume divergence. The same goes if the price makes a new low but with lower sell volume.
As shown below its indicated by an orange candle and these divergence signals are often an indication that price will reverse soon

2.5 No interest signal
The no-interest signal is a reversal signal and appears when buyers (or sellers) are exhausted and have no further interest in continuing to buy( or sell ) the market. The no-interest signal occurs at the end of a trend and indicates a potential reversal
The no-interest signal is based on 3 consecutive price swings
- The 1st swing
- the 2nd (counter) swing. The volume of this 2nd swing is bigger than the volume of the 1st swing and bigger than the volume of the 3rd swing
- The 3rd swing which volume is lower than the volume of the 1st swing
The no-interest marker is displayed by a purple triangle as shown below. Notice how the market reversed after each no-interest signal.

2.6 Market structure up/down swing count
Besides showing HH/LL the indicator can also show the market structure by plotting the up & down count. Every time the market makes a new high, the up count will increase. And vice versa. Every time the market makes a new low, the down count will increase

2.7 Bloodhound/Blackbird/Automated strategies support
The indicator exports several plots for the No Interest & Volume/Price divergence signals which you can use in, Bloodhound/Blackbird, The NinjaTrader Strategy builder, or plain Ninja Script to build your own automated strategies
Plots for:
- No Interest plot
- Price/Volume divergence plot
- Markt structure Up count plot
- Markt structure Down count plot
3. Cumulative Volume ZigZag Histogram indicator
The cumulative volume zigzag histogram is used in conjunction with the order flow zigzag indicator. Where the order flow zigzag indicator shows the price swings on the chart, the volume zigzag histogram indicator displays the cumulative volume for each price swing below the chart. When a new price-swing pivot (up or down) gets detected the volume wave histogram resets back 0. From that point, it will sum the volume for every bar until the next price swing pivot is detected.
This way we get to see the volume for each price swing. By comparing the amount of volume inside a price swing with the actual price movements and with the previous swings we get clear clues of where the market might be heading.
One of the signals shown in the volume zigzag histogram is the price/volume divergence. For example, if price makes a higher high with less volume then the divergence gets detected and shown in the histogram. See below for an example

4. Buy/Sell Momentum indicator
The buy/sell momentum indicator shows several important order flow signals:
- Extreme buy/sell volume at the top/bottom of each candle
- Extreme buy/sell momentum
- Stacked delta imbalances
- Unfinished business
- Delta divergence
- Pickachu delta signal
- Volume POC of each candle
4.1 Extreme buy/sell volume at top/bottom of the candle
This signal indicates when we see that almost all the buy/sell volume inside the candle occurs at the top or bottom of the bar. By default, this will be indicated by a bright green/red outline around the bar, but you can change the colors and whether you want the candle body, outline to be used
If almost ALL the volume of a bearish candle occurs at the bottom of the candle then we have a high chance that the price will continue selling down. The same for the situation where we see that almost all of the volume of a bullish candle occurs at the top of the candle. In that case, we have a very high chance that the price will continue moving up

4.2 Extreme buy/sell momentum
This signal occurs when the buy/sell volume momentum picks up (speed) quickly. When volume picks up aggressively and above the standard deviation of the last X candles then we can be sure that price will follow soon, or that the trend will continue.
By default, this extreme momentum is indicated by one or more triangles inside the candle. For extreme buy momentum, the arrows point up, and for extreme sell momentum the arrows point down. The number of arrows tells something about the force/speed of the buying/selling. One arrow means that the momentum is outside 1 standard deviation. Two arrow means that the momentum is outside 2 standard deviations and 3 arrows indicate that the momentum is outside 3 standard deviations
When we see extreme buy/sell momentum we can expect the price to continue with the trend in the same direction

4.3 Stacked delta Imbalances
Stacked imbalances occur when we have 3 (or more) imbalances stacked on top of each other. This can happen on the bid and/or the ask side
When a stacked imbalance is the indicator will highlight this by drawing a horizontal line for the next 5 bars (you can change the number of bars)
When we get a stacked imbalance on the bid, the indicator will mark this with a red line for the next 5 bars (see screenshot). For a stacked imbalance on the ask, the line will be green

4.4 Unfinished business or failed action
An unfinished business or failed action occurs when
- The market makes a new high but has 1 or more contracts traded at the bid at the high price of the bar
- or the market makes a new low but has 1 or more contracts traded at the ask at the low of the bar
When this happens then this is called unfinished business or a failed action. In general, price likes to return to this level and restest it, or take care of the unfinished business.
The indicator can show unfinished business by a green or red line which stays on the chart until the market returns to retest it. You can optionally choose to hide lines that are retested or keep them on your chart

4.5 Delta Divergence
Delta divergence is shown by a yellow triangle above/below the bar. This signal occurs when:
1) we have a green up bar but with a negative delta. Meaning that although the bar is green, there was more selling volume than buy volume inside the bar.
2) or when we have a red bar but with a positive delta. Meaning that although the bar is red, there was more buying volume than sell volume inside the bar.

4.6 Delta Pickachu signal
The delta pickachu signal is a 2-bar signal and occurs at the close of the 2nd bar. It indicates that 2 opposing delta divergence signals were detected. When this happens the Pikachu signal is shown by a lightning bolt above/below the bar

4.7 Candle Volume POC
The white horizontal line inside each candles indicates the point where most volume was traded for that candle.

4.5 Bloodhound/Blackbird/Automated strategies support
The buy/sell momentum indicator exports several plots for the excessive sell/buy volume & buy/sell momentum signals which you can use in, Bloodhound/Blackbird, The NinjaTrader Strategy builder, or plain Ninja Script to build your own automated strategies
- MomenumShort
- MomentumLong
- ExcessiveBuyVolume
- ExcessiveSellVolume
- DeltaDivergence
- DeltaPickachu
5. Market Extremes indicator
The Market extremes indicator will tell you when multiple exchanges (NYSE, Dow Jones, and Nasdaq) are overbought or oversold. When multiple markets are overbought/sold at the same time we have a very high chance of seeing a reversal or bigger retracements.
This indicator will show (and alert) you in real-time when 2 or more exchanges become overbought/sold. By combining the overbought/sold signal with other signals (e.g. RSI, MACD, or S&R levels) you get very high probability entries
You can use the indicator in auto mode or manual mode. In Auto Mode, the indicator will calculate the standard deviation of all 3 markets and will give you a signal when 2 or more exchanges are overbought/sold.
In manual mode, you define the extreme levels for the NYSE, Dow, and Nasdaq yourself
Click here for more information about this indicator

6. The Devils Volume Indicator

The Devils Volume is an extended volume indicator. Besides the usual up/down volume this indicator will show you high volume candles when the volume is 150% or 200% higher than the previous candles. Of course, you can customize the coloring of these high-volume bars to your liking. Optionally the candles on the chart can be highlighted when a high-volume bar occurs
The indicator can also show liquidity zones. These zones or pools are places where a lot of liquidity can be found. We often see price retracing to these zones during a trend in the form of pullbacks.
7. The Traders Dynamic Index Indicator

he Traders Dynamic Index (TDI) indicator was designed by Dean Malone for assessing the market state and finding trade signals. The TDI is a complex indicator as long as it is based on three other popular indicators:
- the RSI
- A Moving Average,
- and the Bollinger Bands.
The RSI helps to find out whether the current trade is “overheated”. The RSI lines are smoothed out by the Moving Averages. The Bollinger Bands help to assess the oscillation amplitude of the price and the direction of the trend. Thanks to being complex, the TDI may be used as a separate trading system.
The TDI is drawn in a window below the price chart and consists of five lines: two RSI lines and three Bollinger Bands. The green RSI line is called fast, the red one is signal – it is calculated based on a longer averaging period. The RSI lines show the strength and volatility of the market. When they cross, they give short-term TDI signals.
Two of the Bollinger Bands are blue, they constitute a trading channel; the yellow line is called the middle, or main, line. The central axis of the indicator is level 50; levels 32 and 68 are also marked. The area above 68 is the overbought zone and the area below 32 is the oversold zone, as in the classical RSI.
Levels 68 and 32 help to define market reversals. If the yellow line crosses level 32 downwards, a local low forms in the market. A subsequent breakaway of level 32 upwards signals a reversal or the beginning of an ascending correction. If the yellow line rises above 68, local high forms in the market. A breakaway of this level downwards signals a reversal or the beginning of a descending correction.
8. The McGinley River Indicator

The McGinley Dynamic indicator is a type of moving average that was designed to track the market better than existing moving average indicators. It is a technical indicator that improves upon moving average lines by adjusting for shifts in market speed. John R. McGinley, a market technician, is the inventor of the eponymous indicator.
The McGinley Dynamic indicator attempts to solve a problem inherent in moving averages that use fixed time lengths. The basic problem is that the market, being the great discounting mechanism that it is, reacts to events at a speed that a moving average will not be able to cope with. This issue is called the lag, and there is no type of moving average, whether it be simple (SMA), exponential (EMA), or weighted (LWMA), that is not affected by this. Understandably, this will call into question the reliability of that moving average. The McGinley Dynamic indicator takes into account speed changes in a market (hence, “dynamic”) to show a smoother, more responsive, moving average line.
Features
- Combine the power of footprint/order flow charts with the more pleasing look of a normal candle chart
- Show all the important order flow signals on normal candlestick charts
- Orderflow zigzag : our custom based zigzag indicator
- ATR based zigzag to detect the best price swings
- Shows Fibonacci retracements for last price swing
- Shows price/volume divergence signals
- Shows no-interest signals
- Shows HH/LL markers
- Alerts for No Interest and Price/Volume Divergence
- Supports bloodhound/strategy builder
- Volume zigzag histogram indicator
- Shows Cumulative volume / zigzag price swing
- Shows volume /price divergence
- Buy/Sell momentum indicator
- Shows excessive buying/selling volume
- Shows excessive buying/selling volume momentum
- Shows unfinished business order flow signal
- Shows multiple stacked imbalances order flow signals
- Shows delta divergences
- Shows Volume POC for each candle
- Shows delta pickachu signals
- Supports bloodhound/strategy builder
- Market extremes indicator
- Shows when multiple exchanges (Nyse/Nasdaq/Dow) are overbought/oversold
Changelog
v1.0.0.7- 03-may-2022
- fixed issue that Buy/Sell momentum indicator was complaining that it needed the NinjaTrader Orderflow + license
v1.0.0.7- 13-feb-2022
- Added the McGinley River indicator to the package
- Added the Devils Volume indicator to the package
- Added the TDI Traders Dynamic Index indicator to the package
v1.0.0.6 – 9-jan-2022
- fixed issue with bloodhound
v1.0.0.5 – 18-dec-2021
- added the delta pickachu signal
- added the delta divergence signal
- added the volume POC for each candle
- added extra plots for bloodhound/strategies
v1.0.0.4 – 14-dec-2021
- Allow user to change the size of the no-interest markers
- Allow user to change the size of the up/down market structure markers
- Added alerts for No Interest and Price/Volume Divergence
- Added min. levels for TDU Extreme indicator
v1.0.0.3 – 28 November 2021
- Added option to show market structure up/down count
- Added plots for up/down count for BloodHound
- Added setting to specify the bar y-offset for the HH/LL markers
v1.0.0.2 – 27 November 2021
- buy/sell volume indicator: added support for bloodhound/blackbird
- buy/sell volume indicator: fixed issues that arrows were too big
v1.0.0.1 – 20 November 2021
- added multiple stacked imbalances signal
- added unfinished business signal
v1.0.0.0 – 20 November 2021
- first release
Terms
All our indicators and packages come with
- a one-time fee only
- lifetime license for 1 pc (we offer 20% discount for 2nd licenses)
- includes free future updates
We also offer a 100% free 5-day trial of all our indicators allowing you to test our software before you decide to invest in it. Since you are able to test all our software before buying it all sales are final and non-refundable!
DISCLAIMER
Please note that the market extremes require real-time ^TICK data for the NYSE, DOW, and Nasdaq. This is NOT included in your default data subscription. Please consult your broker on how to get this data. Without this real-time data, this indicator will not work!!
Media


Reviews
There are no reviews yet.