1. Overview
The TDU Market structure / Smart money indicator is the first indicator for NinjaTrader 8 which can display market structure over multiple timeframes in real-time
Our sophisticated trend analysis will tell you if the trend is up and down in each timeframe. It will spot & display BOS (break of structure) when the trend reverses. But not only that, but it will also show you the ChoCH (Change of Character) which often is the first indication that the trend might change or pull back. So you will be the first to know about a potential trend change using our ChoCH markers and will know exactly when the new trend is confirmed using the BOS
Besides the BOS and ChoCH, this indicator will also show you the weak & strong swing hi’s and lows and the internal hi & low.
And of course, it draws up the supply/demand zones since that’s a major part of the smart money concepts.
But that is not all. One of the unique features of this indicator is the ability to plot market structure from higher timeframes onto the current chart. So you want to see the 4h market structure on a 15min chart? no problem. In fact, if you look at the following screenshot you will see that we get all the market structure from the daily, 4 hours, 15min, and 5min timeframes into 1 chart. Of course, you are free to choose which and how many timeframes you would like to see on the chart.
Notice these little checkboxes in front of each time frame? By simply clicking on them you can hide all the market structure from that time frame. Click it again and the market structure of that timeframe gets displayed again. This way you can have clean uncluttered charts, but the moment you need some more info, then all you need to do is click on one or more checkboxes to quickly display the higher timeframe market structure.

2. Market Structure
2.1 Break of structure (BOS)
The market structure is the big picture, it detects and shows the trend and detects any trend changes. Using a sophisticated algorithm it detects major swing hi’s and lows and plots these on your chart. Trend changes, also known as Break of Structure (BOS) are marked on the chart when they occur.
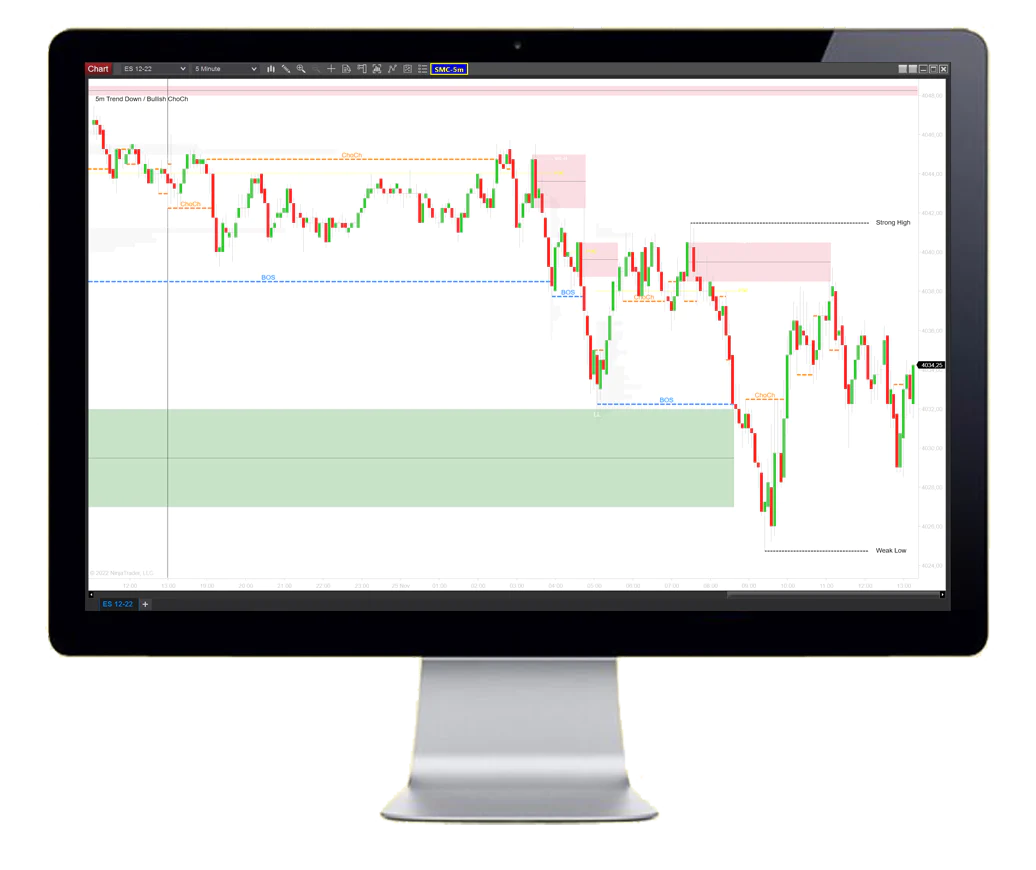
The following screenshot shows both a BOS to the upside, confirming the bullish trend, and later on, a BOS to the downside confirming that now the trend has changed and is bearish
Note that a BOS itself is not a trade entry. It just tells us the direction in which we want to trade. So a BOS to the upside confirms a long trend, which would mean we would only look for long entries. A BOS to the downside confirms a downtrend which means we only look for short entries

2.2 Strong and Weak hi/lo’s

The indicator shows the last important swing high and low and whether it’s a strong or weak one.
A strong high occurs when a new low was formed after the high. If a high failed to make a new low then we consider it a weak high
A strong low occurs when a new high was formed after the low. If a low failed to make a new high then we consider it a weak high
In general, we always looking for trade entries :
- With the trend as defined by the last BOS
- And in the direction towards the weak low or weak high
Why do we take trades towards the weak low or weak high? Since we assume that the strong high/low is going to hold. Remember if a Low is able to make a new High then this makes it a very strong low. A lot of money was put into that low to be able to make a new high. So what would we expect after the High? We would expect a pullback to make a higher low. Since there was a lot of money involved in creating a new high we would not expect for price to reverse and take out that strong low. Instead, we expect a pullback to make a new HL, and then take out the weak high to make a new HH
See the following screenshot:

2.3 Market structure settings

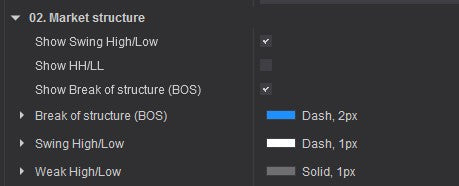
A) SHOW SWING HI/LOW
This will show or hide the swing High/Low horizontal lines.
B) SHOW HH/LL
This will show or hide the HH/LL/LH/HL labels above/below the swing points
C) SHOW BREAK OF STRUCTURE (BOS)
This will show or hide the break of structure lines
3 Market sub-structure settings
The market substructure is plotting the smaller trend within a bigger trend.
It often shows you the first signs that the trend will pull back or start to reverse. Remember a trend reversal is confirmed by a BOS, However, before we get a BOS we often see a change of character (ChOCh) in the market. When looking for trade entries we always trade in the direction of the BOS. But like we said a BOS by itself is not a trade entry. Instead, we wait for the price to pull back and find then find an entry. Let’s say that the trend is bearish, so we had a bearish BOS. Next, we wait for the price to pull back. On a lower timeframe, this pullback often generates a bullish ChoCh. So we wait for a bullish ChoCH on a lower timeframe.. followed by a bearish ChOCH. Now the lower timeframe is aligned with the higher timeframe and the pullback might be over so we can look for a short entry
See the following screenshot which shows a 5min chart with the market structure of both the 15min and 5min timeframes. Note that at the left arrow we get a bullish BOS (blue line) meaning the trend is up. Next, we wait until we get a bullish ChoCH (orange line) on the 5min timeframe which confirms that now the lower time frame aligns with the higher timeframe. From there we open a trade with the stop below the low and could have made a 7R + trade.


A) PAINT INSIDE BARS
Inside bars on a higher timeframe are ranges on a lower timeframe. We want to know about this because its a possible supply/demand zone. By enabling this option all inside bars will be colored with the color of your choice (default white)
B) SHOW CHANGE OF CHARACTER (CHOCH)
Here you can choose if you want to display or hide the CHoCH.
C) SHOW INTERNAL HIGH/LOW
Here you can choose if you want to display or hide the internal swing hi/lo’s
4 Multi-timeframe settings

One of the unique features of this indicator is the ability to display market structure from multiple timeframes on 1 chart. To do this you go to the indicator settings and enable the Use MTF checkbox. Next, select the timeframe you want to display and that is it. Now the indicator will display the market structure from the timeframe you selected on to your chart. If you want to show multiple timeframes on 1 chart then just add the indicator multiple times to your chart and change the MTF settings for each instance.
For example, I might have a 1min chart with 4x market structure indicators
- 1st indicator is set up to show MTF 1 day
- 2nd indicator is set up to show MTF 240min (4 hours)
- 3rd indicator is set up to show MTF 15min
- and 4th indicator does not use MTF, It just shows the structure for the current chart timeframe:
The following screenshot shows what that would look like in NinjaTrader. As you can see we added 4x TDU Market Structure indicators to a 1min chart. And each indicator has different settings for the MTF Period

5 Trend settings
In this section, you can specify if and where the trend should be shown. See the following screenshot. Note that you can click on the checkbox to quickly hide/show the market structure for that timeframe

a) Show trend. Use this to display or hide the trend
b) x & y position is simply the x&y coordinates on the chart where the trend should be shown
6. Supply / Demand

7. Features
- Plots Strong & Weak Swing hi/lo’s
- Plots Internal structure hi/lo’s
- Plots BOS (Break of structure)
- Plots ChoCH (Change of Character)
- Plots Supply / Demand zones
- Plots HH/LL/LH/HL
- Plots Orderblocks
- Plots Fair value gaps
- Plots volume profile for BOS and volume profile zones
- Trend Paint bars
- Plots Fibonacci retracements
- Alerts
- Supports plotting multiple timeframes on 1 chart
- Shows trend statistics
8. ChangeLog
26-Oct-2022 v1.0.1.3
- fixed performance issues
23-Aug-2022 v1.0.1.0
- added option to turn BOS / ChoCh alerts on/off in dropdown menu
- smalf fix: always show BOS/ChoCh structure mapping in settings
- small fix: trend display was delayed when using MTF
08-Aug-2022 v1.0.0.9
- removed empty spots in the dropdown menu
- added a new feature to display the trend in the top left, top right, bottom left, bottom right
- fixed overlapping chocs & BOS labels
- Added Market Swing High/Low plots for bloodhound/strategies
- Added Internal swing High/Low plots for bloodhound/strategies
07-Aug-2022 v1.0.0.8
- added option to the dropdown menu to enable/disable the entire indicator
- added timeframe to chart button
- added timeframe to trend display
07-Aug-2022 v1.0.0.7
- added dropdown menu for easy access to all indicator settings
- added fair value gaps
- added order blocks
- added option to specify how many BOS it takes to consider a trend change
- added much improved BOS & ChoCH detection
- added much more options to change colors & fonts
28-apr-2022 v1.0.0.3
- added option to specify swing structure in ATR, percentage, or ticks
- added option to show BOS/ChoCH as line only, line + text or line + text + timeframe
- added option to only show the last X number of ChoCH
- added option to only show the last X number of BOS
- added option to only show [X} supply/demand zones around the current price
- fixed ChangeOfCharacter plot not working
- added plots for each fib. level which can be used from strategies/bloodhound
23-april-2022 v1.0.0.2
- various bugfixes
31-march-2022 v1.0.0.1
- initial release
9. Multi timeframe chart Template
Download the chart template for displaying the 4hr, 1hr, 15min, and current timeframe in 1 chart
10. Terms
All our indicators and packages come with
- a one-time fee only
- lifetime license for 1 pc (we offer 20% discount for 2nd licenses)
- includes free future updates
We also offer a 100% free 5-day trial of all our indicators allowing you to test our software before you decide to invest in it. Since you are able to test all our software before buying it all sales are final and non-refundable!
11. Media


Reviews
There are no reviews yet.